Know What Every Robot Is Doing — Without Logging Into One
When one of 500 robots slows down, the first problem is finding it. WendyOS has every device report its own health so you can spot the problem without logging in and follow it from fleet-level symptoms to one slow operation. The examples use illustrative data, not real measurements.
You can't log into five hundred robots
For one device on your desk, logging in over SSH is fine. Open a shell, run htop, read a log file, and you can see what is happening.
Now put that device in a warehouse with an unreliable connection. Then add 499 more. Opening one terminal at a time is no longer a diagnosis strategy.
There is a deeper problem: logging in only works when you already know which robot to inspect.
Fleet problems begin with questions like these:
- Which devices are overheating right now?
- Which app became slow after the last update?
- Why did one warehouse robot disappear from the network at 3am?
You do not know which terminal to open until after you know the answer. The devices need to report what is happening continuously, in one place you can search.
We cover the scaling problem with SSHing into your robots separately. This post is about what replaces it.
That's the whole idea behind observability: instead of you going in to look, each device sends out a running account of what it's doing, and something off the device gathers it all up. That account comes in three kinds of signal:
- Logs — a timestamped record of what happened ("started detection", "camera reconnected").
- Metrics — the numbers, sampled over time: how busy the CPU is, how much memory is free, how hot the chip is.
- Traces — a timeline of a single request as it passes through the different parts of an app, so you can see where the time went.
OpenTelemetry, or OTel, is the open standard for producing and moving those three signals. WendyOS speaks it out of the box.
Before looking at how the data moves, look at what you can do with it.
Scene 1: the device dashboard
This is a browser version of wendy device top, the live view for one WendyOS device.
Sample data generated in your browser — not a benchmark. The real wendy device top surfaces CPU, memory, GPU, per-zone temperature, and battery; the network meter here is illustrative only. The 85°C warning threshold and the offline banner are the real ones.
See the slowdown before the crash
When a robot's chip gets too hot, it slows itself down to cool off. The vision app may start missing its timing target long before anything crashes.
wendy device top watches every temperature sensor. A reading turns yellow as it approaches its safe limit and red when it reaches it.
The color change is the useful part: it gives the operator a warning while the robot is still running, not an explanation after it has stopped.
Silence is also a signal
A robot can go quiet because it lost power, dropped its connection, or drained its battery. A basic dashboard leaves the last values frozen on screen. Those frozen gauges can look healthy.
WendyOS puts an offline banner over the status line instead. The last readings remain visible, but they are clearly marked as stale.
If the battery was falling before contact was lost, the operator can still see its final level. "Haven't heard from this device in 41 seconds" becomes useful evidence instead of an empty patch in a chart.
Everything the dashboard shows is made-up sample data generated in your browser. What's real is the shape of it — CPU, memory, GPU, per-sensor temperature, battery, the heat warning, the offline banner. (The network meter is there only for the demo; wendy device top doesn't actually show a network column.)
Scene 2: following one trace off the device
A dashboard tells you that something is slow or hot. A trace tells you where the time went.
The scene below follows one perception cycle:
- grab a camera frame;
- run object detection on the GPU; and
- publish the result.
Each timed step is called a span. The spans form a waterfall, making the slowest step easy to spot.
The spans and their related logs carry the same trace ID and app name, keeping every signal tied to this cycle.
Illustrative trace. Logs and spans an app exports over OTLP land at the agent's local collector and are stamped with the app's service.name, so wendy device logs --app <id>, wendy run, and the MCP telemetry tools all see the same correlated stream.
Here, inference.detect exceeds its time budget while the temperature rises, and the correlated warning identifies thermal throttling as the likely cause. The operator can move from symptom to cause without matching timestamps by hand.
How it actually works on WendyOS
Your app does not need a Wendy-specific way to report its condition. It sends data in OTLP, the standard format used by OpenTelemetry tools, to a collector on the device.
WendyOS handles the rest.
WendyOS points the app to the collector
When WendyOS starts an app, it supplies the standard OpenTelemetry settings: where to send data, the app's name, and its identifying tags.
If the app already provides those settings, WendyOS leaves them alone. An app using a standard OpenTelemetry library — such as swift-otel in our Swift stack — can report without Wendy-specific code.
The collector gives every signal the same label
A small collector inside the Wendy agent receives the stream. It also captures the text the app normally prints and turns it into searchable logs.
The collector labels both sources with the same app name and ID. A deliberate telemetry event and a plain print statement can therefore appear in one filtered view.
From there, the collector can forward the stream to Wendy Cloud.
Four ways to read the result
The same gathered stream appears through:
wendy runprints your app's telemetry inline as it deploys and runs, right next to the app's normal output — so you see it during development with no extra setup.wendy device logs --app <id>streams the logs from a device, filtered to a single app. It replays a recent chunk, then follows along live.wendy device topis the live dashboard from Scene 1.- The Wendy telemetry tools for AI assistants —
telemetry_logs,telemetry_metrics, andtelemetry_traces— provide small snapshots filtered by app, severity, and other fields.
That last path lets an assistant investigate "why is the vision app slow on device 12?" using real evidence. It is similar to how voice AI agents on the edge read live device state.
Why this shape fits the edge
Cloud monitoring often assumes a steady connection and plentiful computing power. Robots have neither. Their connections come and go, while power and heat budgets stay tight.
That is why the collector runs on the device. Its position changes three things:
- Data can wait locally during a network drop and continue upstream when the link returns.
- The robot can react immediately to heat or a low battery instead of waiting for a cloud round trip.
- The heavier work of combining and searching fleet data still happens off the robot.
OpenTelemetry keeps that path portable. You can retain the dashboards and tools you already use; the robot becomes another source speaking the same standard.
On WendyOS, observability is not a separate product to bolt on. The same wendy used to deploy an app also watches what was deployed.
Close
Observability has to cover an entire fleet and one slow operation. Neither view requires opening a shell on the robot.
The dashboard readings and the trace timings in this post are illustrative sample data generated in your browser, not measurements from a real device. The commands and the OpenTelemetry pipeline behind them are the real ones from WendyOS.
Related post
Expand your knowledge with these hand-picked posts.
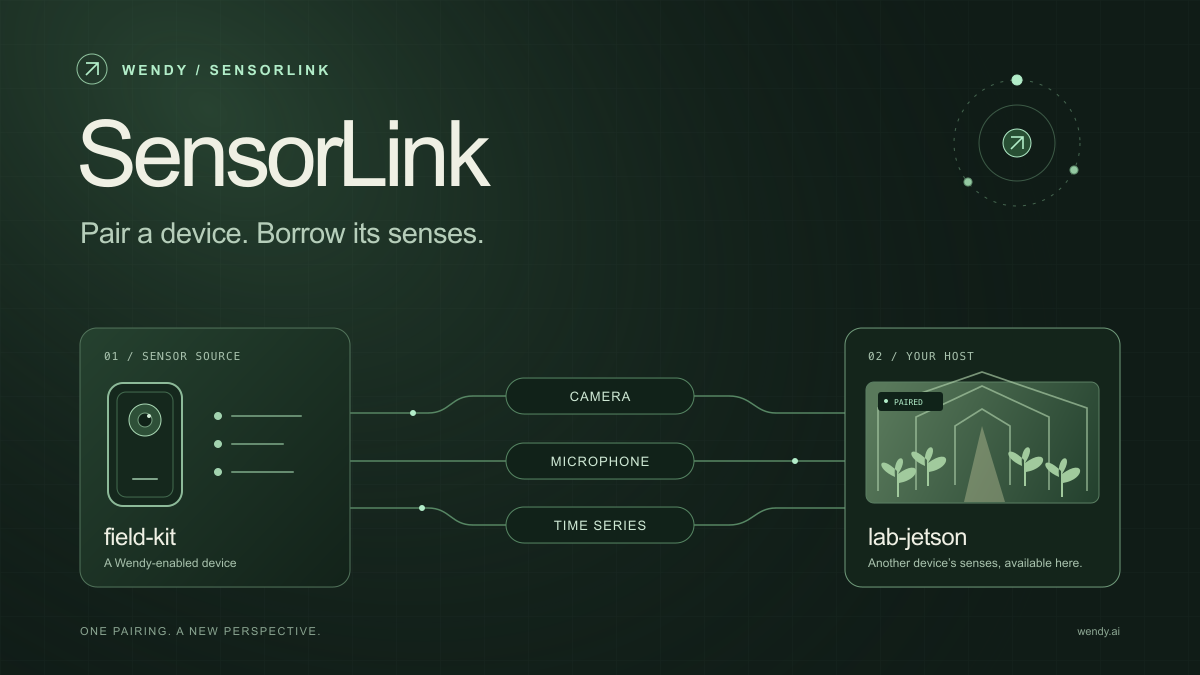
SensorLink: Pair a Device. Borrow Its Senses.
Give your Wendy host the eyes and ears of another device. SensorLink brings cameras, microphones, and a shared model for time-series sensors into a familiar pairing workflow.
Wendy Labs - Wendy Labs Team
Free NVIDIA DGX Spark 3D model
Download our free NVIDIA DGX Spark 3D model as a GLB or an editable Blender scene with studio lighting, materials, and cameras. No signup required.
Wendy Labs - Wendy Labs Team
Start with one device. Close the loop around it.
Use WendyOS on your hardware or add Wendy Agent to an existing Linux or Apple Silicon Mac. Connect sensors, run your code, and carry what you learn into the next release.